Course navigation
-
Unit 1 - Send Messages Between Micro:bits
Unit 2 - Create a 'Hot' and 'Cold' Game with Two Micro:bits
1—Show the Signal Strength Between Two Micro:bits
2—Make a Chart of the Signal Strength
3—Display a Victory Message When the Micro:bits Are Nearby
4—Checkpoint!
Unit 3 - Create Digital Art with Micro:bits and Bluetooth
Make a Chart of the Signal Strength
Use code to detect the signal strength between two micro:bits and plot the result on a bar chart.
Step 1
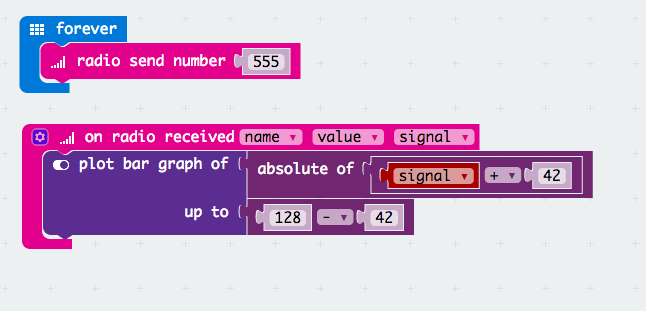
Challenge: Create a program that shows the current signal strength between two micro:bits on a bar chart. The bar chart should change as the signal strength changes.
Speak with a partner about what you need to do to code this app.
Look through the palette. Which blocks might be most useful?
Step 2
Test your solution on the simulator.
Download your code onto the micro:bit and test it.
Tip: There's no right way to complete this challenge, but here’s one way you might do it. The weaker the signal, the more lights are turned on.
